|
|
|
|
|
Linux Training 1825 Monetary Lane Suite #104 Carrollton, TX Do a presentation at NTLUG. What is the Linux Installation Project? Real companies using Linux! Not just for business anymore. Providing ready to run platforms on Linux |
On this page... (hide) 10 Gbit NFSWith the advent of affordable 10 Gbit ethernet, iSCSI has become a viable Direct Attach (DAS) or Storage Area Network (SAN) solution. But what about Network Attached Storage (NAS)? In particular, does 10 Gbit offer significant performance for networked storage protocols like the Network File System (NFS) that is commonly used by heterogeneous systems including most *ix platforms including Linux? 10 Gbit ThroughputIn theory the common ethernet speeds for LANs breaks down like this performance wise (in MB/s since we're talking ultimately about storage performance):
So... theoretically speaking, without overhead, the best we can do network wise unidirectionally is 1250 MB/s. So how fast is our network really? Our 10 Gbit Network SpeedUsing iperf 2.0.4 over many, many tests, the results always produced: # iperf -t 60 -c myserver ------------------------------------------------------------ Client connecting to myserver, TCP port 5001 TCP window size: 16.0 KByte (default) ------------------------------------------------------------ [ 3] local 192.168.1.2 port 57561 connected with 192.168.1.3 port 5001 [ ID] Interval Transfer Bandwidth [ 3] 0.0-60.0 sec 65.6 GBytes 9.39 Gbits/sec So, for our network, the theoretical max is ~1174 MB/s. The reason why it is a bit lower than 10 Gbit is because our network does not use Jumbo Frames of size 9000, but rather the default value of 1500 bytes per frame. Even at 1 Gbit speeds, using jumbo frames is preferred, but because our network is heterogeneous, we have chosen to not modify the frame size. Unfortunately, at 10 Gbit speeds, this small inefficiency due to frame size turns into a measurable performance loss. Even so, as the earlier chart shows, we can expect significant performance improvements by using 10 Gbit. Note: even with jumbo frames, our network will likely not completely reach theoretical maximum rate. Testing 10 Gbit NFSHardware Specifications
The storage is limited by a 4 Gbit (500 MB/s) Fibre Channel infrastructure. However we are striping across two 4 Gbit pathways. NFS SpecificationThe number of nfsd's on the server platform has been raised to 128 (default is 4? It's something pretty low.). With regards to rsize and wsize, we are NOT setting those. Since both the client and server are new enough, NFS on Linux will supposedly automatically negotiate the largest values of those parameters when they are not set. Linux NFS now sets the maximum of these to 1MB (in earlier 2.6 kernels and older, the maximum was 32K). Performance with NFS sync turned on is not all that different EXCEPT where metadata, file creates, deletes are concerned. Then the performance impact is huge. Therefore, like most commercial high end NFS based NAS systems, we have enabled the async option on the server. Bonnie++, Good and Yet HatedBonnie++ is one of the best and easiest to run overall disk performance tests created. Unlike its predecessor (bonnie), bonnie++ does a good job of presenting results that test the actual storage and filesystem rather than relying on cache to skew the numbers. So by default, bonnie++ will use data sizes that are twice as large as main memory. In our case, we have slightly less than the 4 GB that we requested in our client. Thus bonnie++ will chose ~7G for its data loads. $ cd /raid60
$ bonnie
Version 1.01d ------Sequential Output------ --Sequential Input- --Random-
-Per Chr- --Block-- -Rewrite- -Per Chr- --Block-- --Seeks--
Machine Size K/sec %CP K/sec %CP K/sec %CP K/sec %CP K/sec %CP /sec %CP
myclient 7G 282026 97 549537 35 337134 44 319974 99 1140086 53 1545 2
------Sequential Create------ --------Random Create--------
-Create-- --Read--- -Delete-- -Create-- --Read--- -Delete--
files /sec %CP /sec %CP /sec %CP /sec %CP /sec %CP /sec %CP
16 4812 23 +++++ +++ 5041 13 4823 16 +++++ +++ 4943 12
My own personal experience with bonnie++ is that it does a really good job of showing the top performance of a device and/or filesystem and I find the Sequential Output Rewrite value to be indicative of overall mixed read/write performance. So... why the hate? I can only guess that due to its predecessor and/or due to some early bug, that bonnie++ has received a bad reputation. With that said, we'd like to use a test that others might accept (even though, bonnie++ is showing us reasonable data here, notice 1140 MB/s on Block Seq. Input). Enter Iozone, Good (but NOT by default) and AcceptedUnlike bonnie++, iozone does not attempt to remove cache from the equation by default. With that said, I find that most iozone results I've found show people doing exactly that, which means there is a LOT of bad iozone data results out there. To avoid cache skew, we need to use file sizes in iozone testing that are twice the size of main memory. In our case we already know that 8G is more than twice the size of the client's memory. Iozone has many test modes for reading and writing (more than bonnie++, but not too much more). We can tell iozone to test using different record sizes. To simulate what happens in a default all set of tests, we'll run 8GB file size tests using 4, 8, 16, 32, 128, 256, 512, 1024, 2048, 4096, 8192 and 16384K record sizes. Between each test run, we'll unmount the RAID60 NFS area and remount it in order to attempt to further clean out any cache enhancements. size=$1
size=${size:=8g}
PATH=$PATH:/iozonepath
recs=4 8 16 32 64 128 256 512 1024 2048 4096 8192 16384
for rec in $recs; do
echo "
echo **** $rec ****
echo "
umount /raid60
mount /raid60
iozone -s $size -r $rec -z -R -c -f /raid60/t1 -b exceloutput-$size-$rec.xls
done
If you choose to run this script, realize that it will take some time to complete. Just make sure you adjust the size appropriately. Obviously, a size of 96 GB will take a VERY long time to complete. Therefore our client was booted with mem=4G in order to reduce the amount of data we need to use for proper testing. Results and Analysis (Good Guesses)
Sometimes it helps to visualize the data so that trends can be seen: 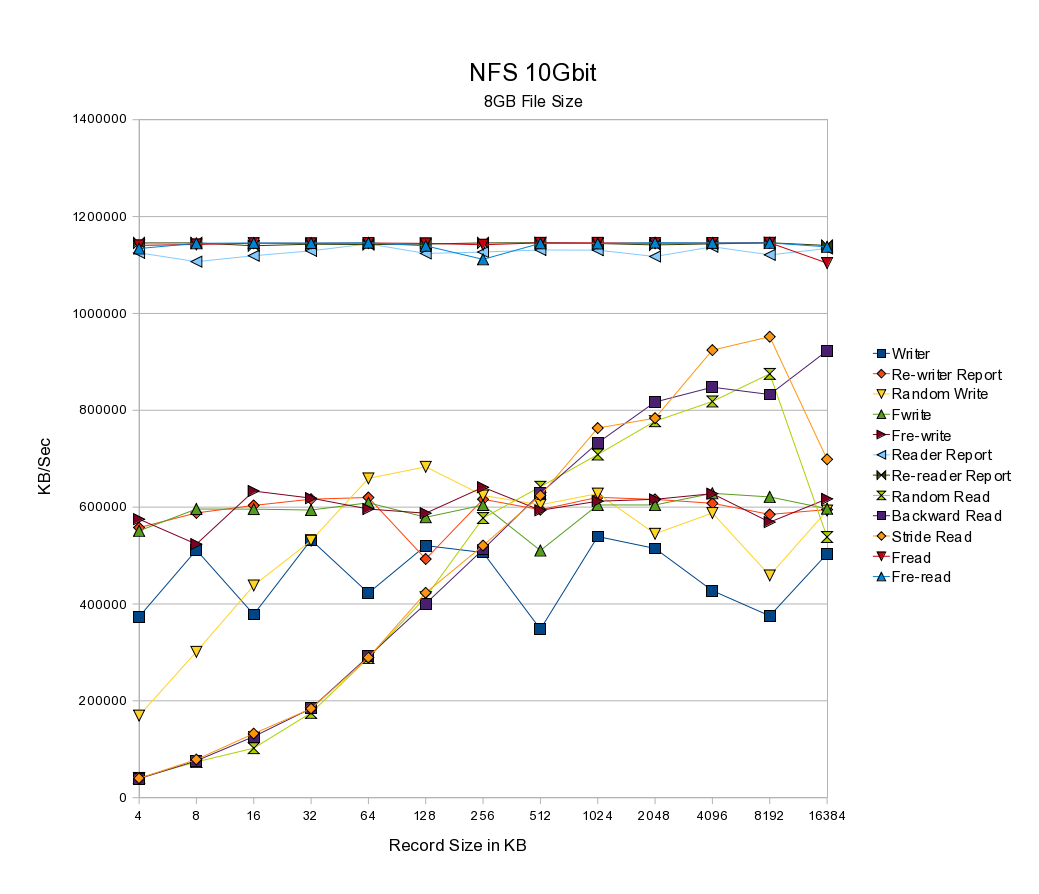 You can see from the diagram that most of the reads exhibit similar results to bonnie++. Writes are supposed to be limited (in theory) to the 4 Gbit FC on the RAID subsystem. However, we HAVE created a RAID 60 across two different storage arrays, so striped across dual 4 Gbit connections. Observations and Guesses
Phoronix Test Suite Resultshttp://global.phoronix-test-suite.com/?k=profile&u=cjcox-17384-3855-8027 |
